There are four report types available in QualBoard. Your options are a Crosstab, PDF Transcript, Excel Transcript, Word Transcript or Polling. The Crosstab and Polling reports are only available as an Excel file.
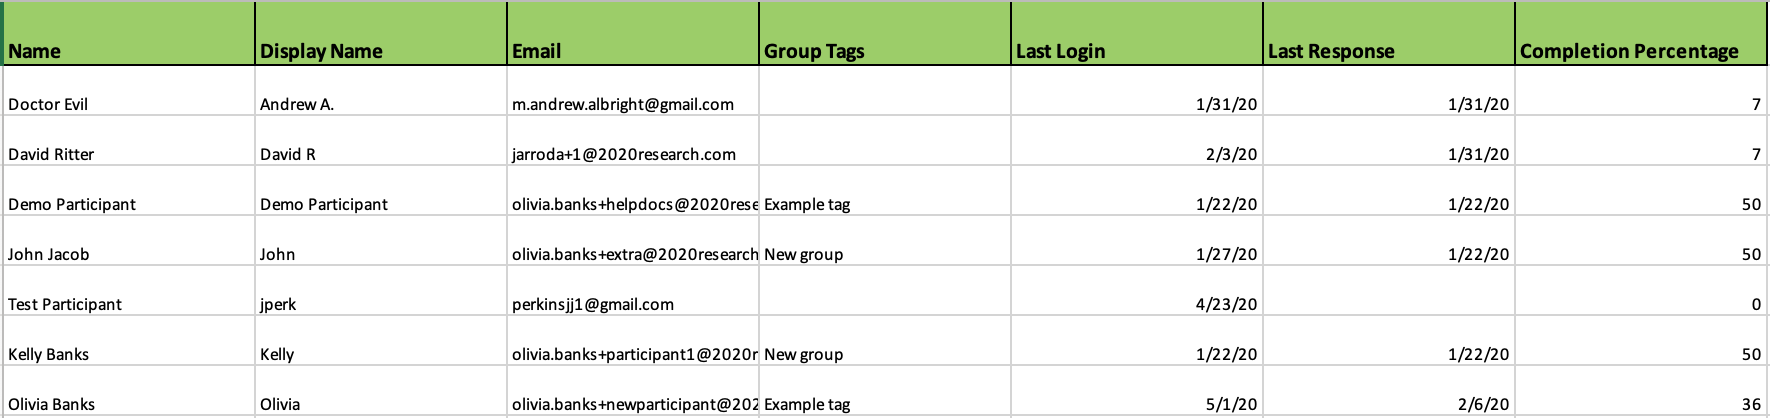
A Crosstab Report is a full transcript with followups and insights that break the data down where each question is its own column and each row is its own participant. It's great for showing relationships between different responses. The Crosstab Report is separated into several different tabs: the project users tab and a tab for each section of a Group Discussion/Quick Poll or each repetition of a Diary. The Participants tab lists all participants from the event along with any information in the participant profile including demographics and group tags. Here's an example of what the participant's tab looks like:
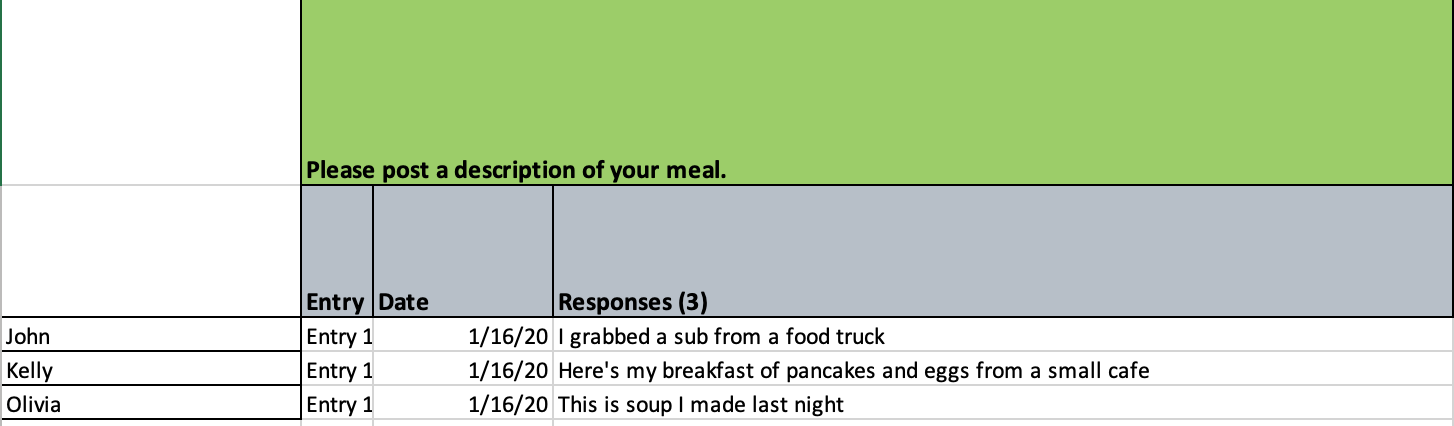
In each of the other tabs, the first column lists the participants and the subsequent columns contain the responses and data about those responses. The top row contains the question text as well as any media from the original task. Here's an example of what an event tab looks like:
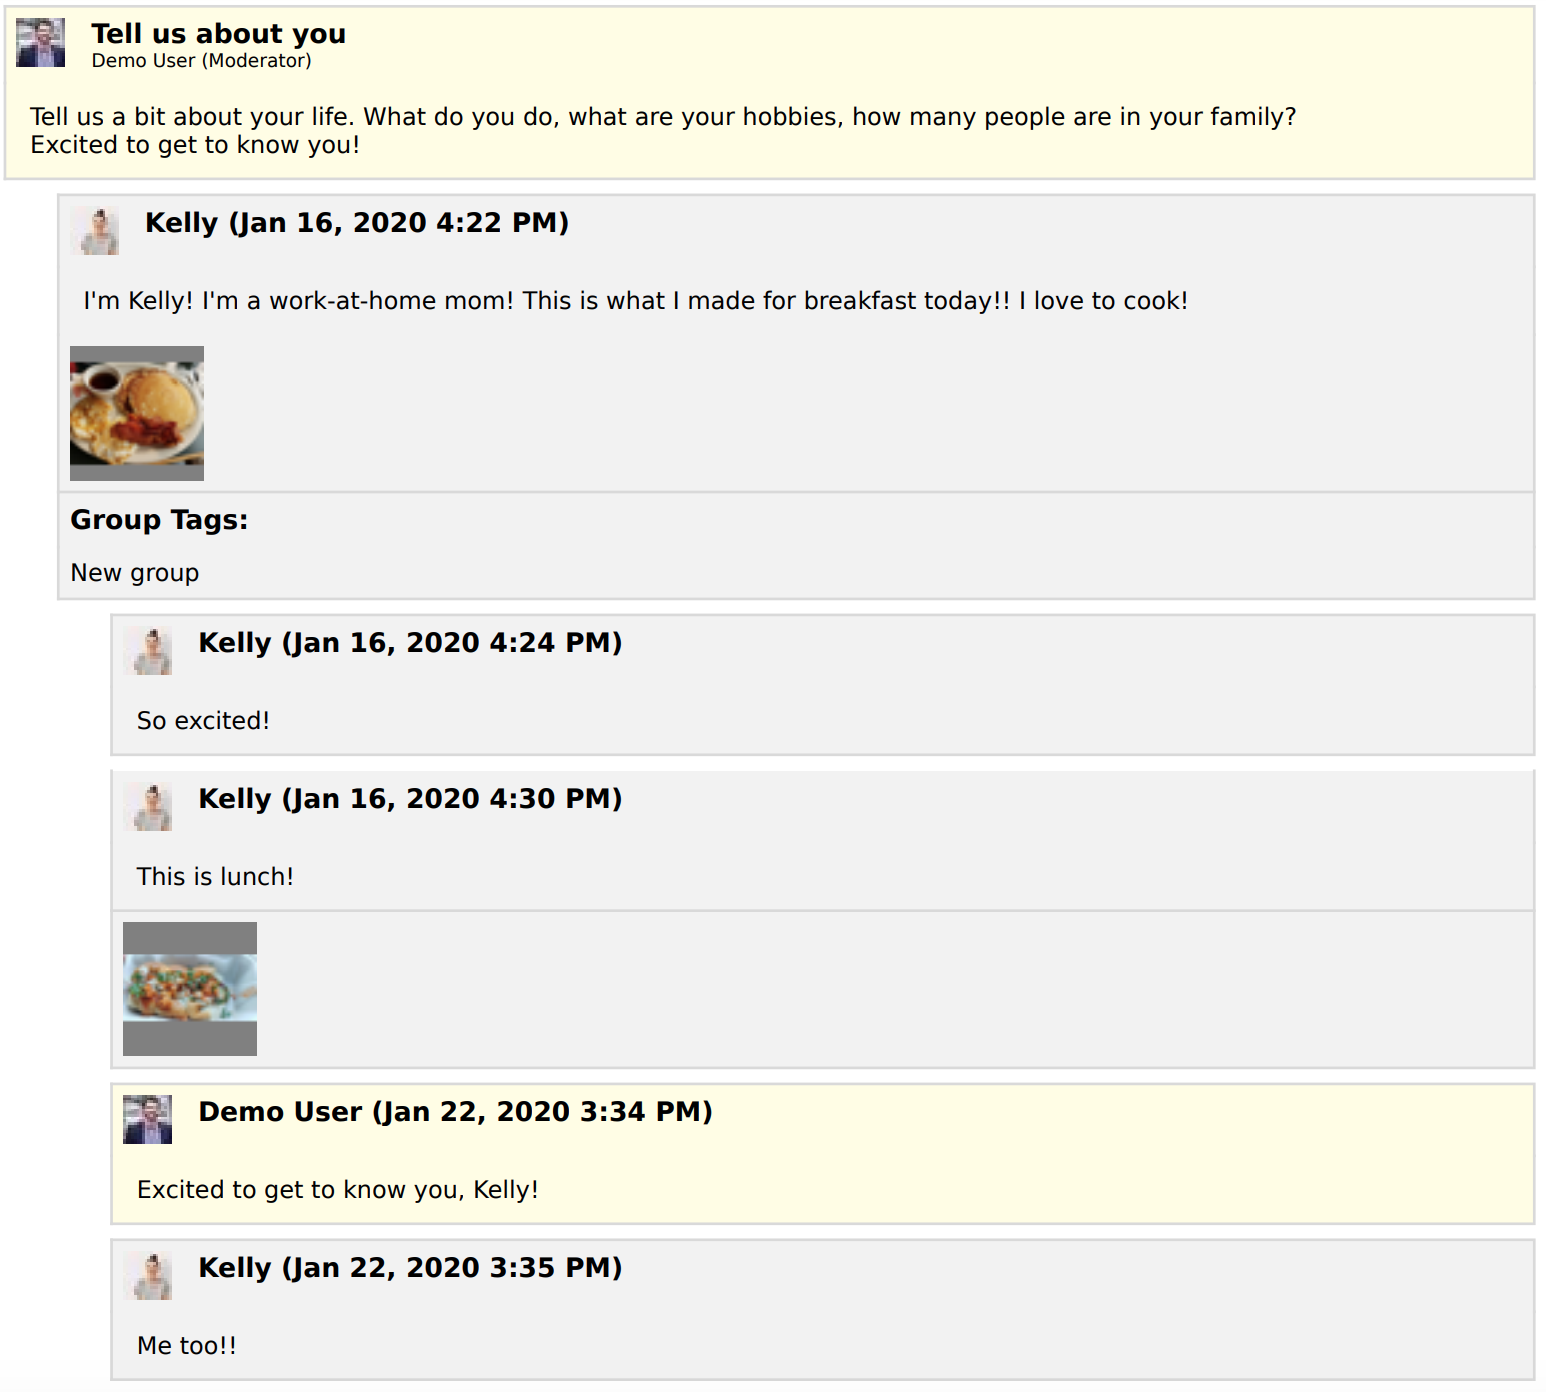
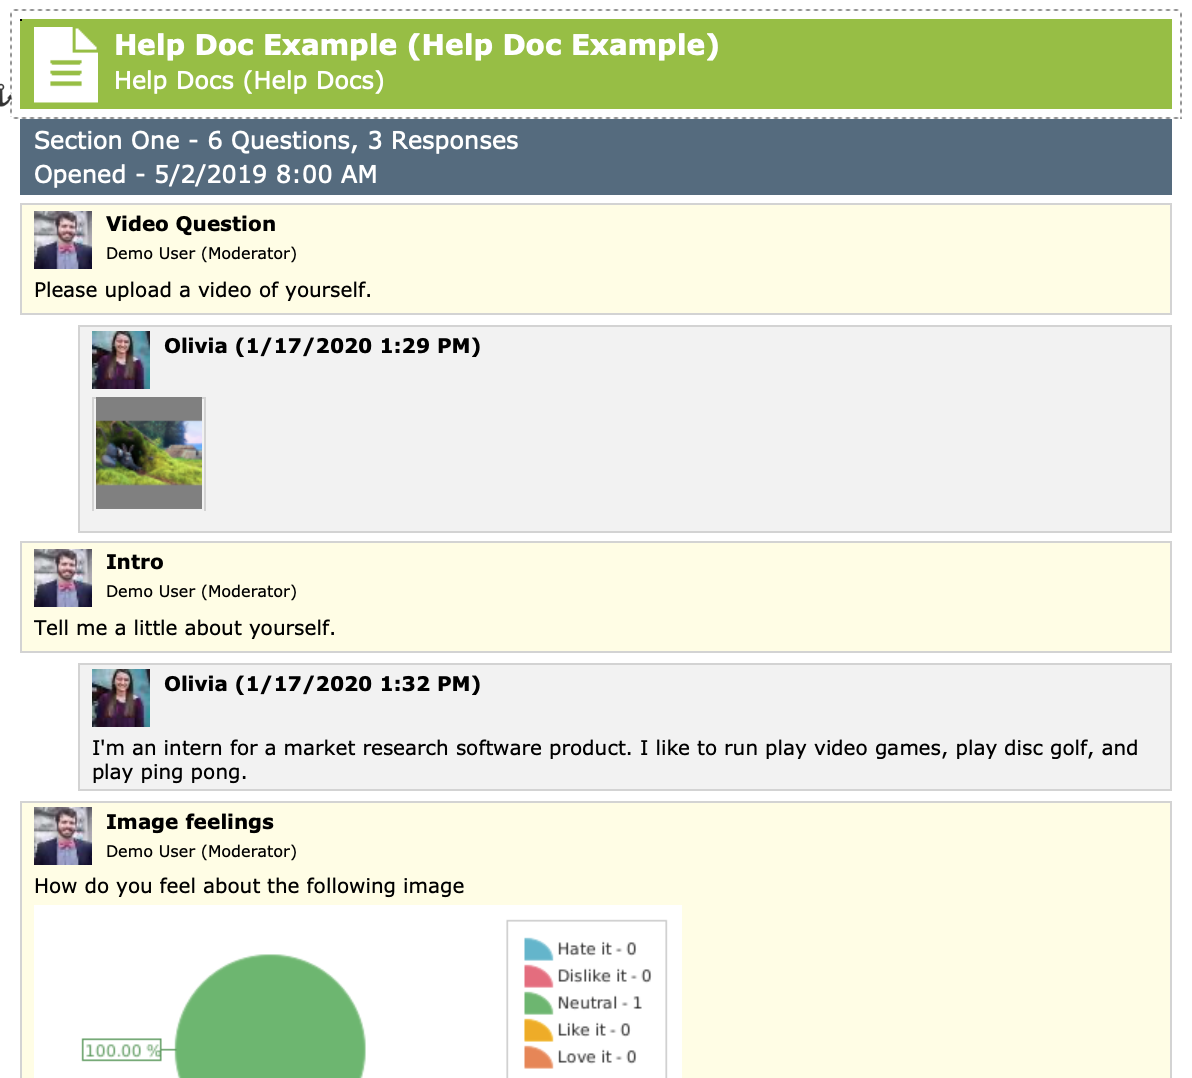
A Transcript report is great for getting data in the most similar format to how you read it in the system. Responses are nested under questions in the same order that they are programmed. You can add filters for users, group tags, and insight tags and also view additional data like what groups a user is in or what insights were left on a post. Here is an example of what a PDF Transcript Report looks like:
Excel Transcript
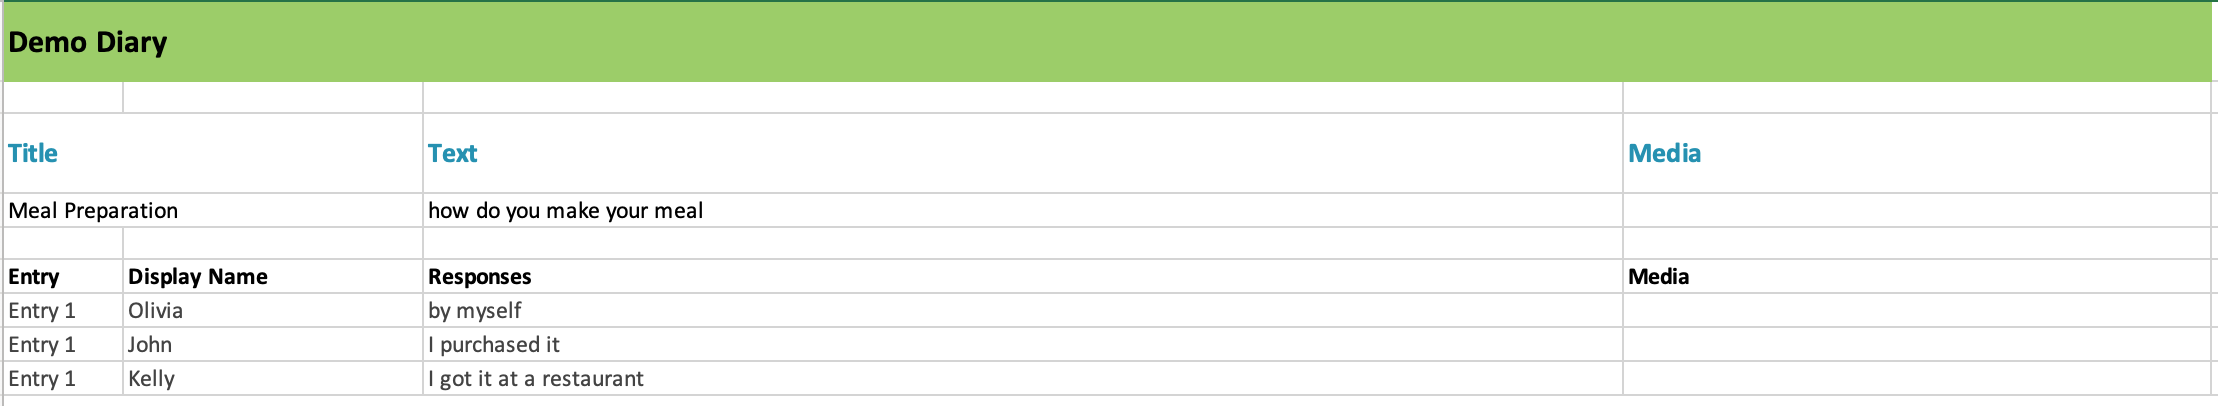
Similarly to the PDF transcript, an Excel transcript shows the data question by question similar to how you would find it in the responses view of the events. You can add filters for users, group tags, and insight tags and also view additional data like what groups a user is in or what insights were left on a post. Here is an example of what an Excel Transcript looks like:
Word Transcript
Similarly to the PDF transcript, a Word transcript shows the data question by question similar to how you would find it in the responses view of the events. You can add filters for users, group tags, and insight tags and also view additional data like what groups a user is in or what insights were left on a post. Here is an example of what a Word Transcript looks like:
Polling Report
A Polling Report exports raw data and allows you to easily sort and filter your insights by groups tags, questions, and responses. This is the best report for analyzing your quantitative data. Here is an example of what a Polling Report looks like:

Insight Report
An Insight Report exports each insight made and allows you to easily sort and filter your insights by groups tags, questions, and responses. This is the best report for analyzing your Insights. Here is an example of what a Insight Report looks like:
